
WINDSOR’S CLIMATE CHALLENGE
The Town of Windsor is on the front lines of dealing with the impacts of the climate crisis. Wildfires are becoming hotter, more frequent, more severe, and more deadly. In addition, extreme rainfall and associated flooding, shifts in vector-borne diseases, prolonged periods of drought, and extreme heat are already affecting the community and are likely to only get worse. All of these extreme weather events affect our personal health and wellbeing, our businesses, local and regional transportation systems, recreation opportunities, and the health and vitality of our community. Changes in temperature and precipitation are the main climate drivers to multiple climate hazards (e.g., drought, wildfire, flooding, extreme heat) which directly and indirectly impact our infrastructure, economy, environment, and community. For more information about the impacts of these changes, download the Town of Windsor Community Vulnerability Assessment below. Have some questions or want to better understand the basics of climate science? See Climate Science 101 here, this Guide to Understanding Climate Change here, and this guide (directed at youth) here.

WILDFIRE

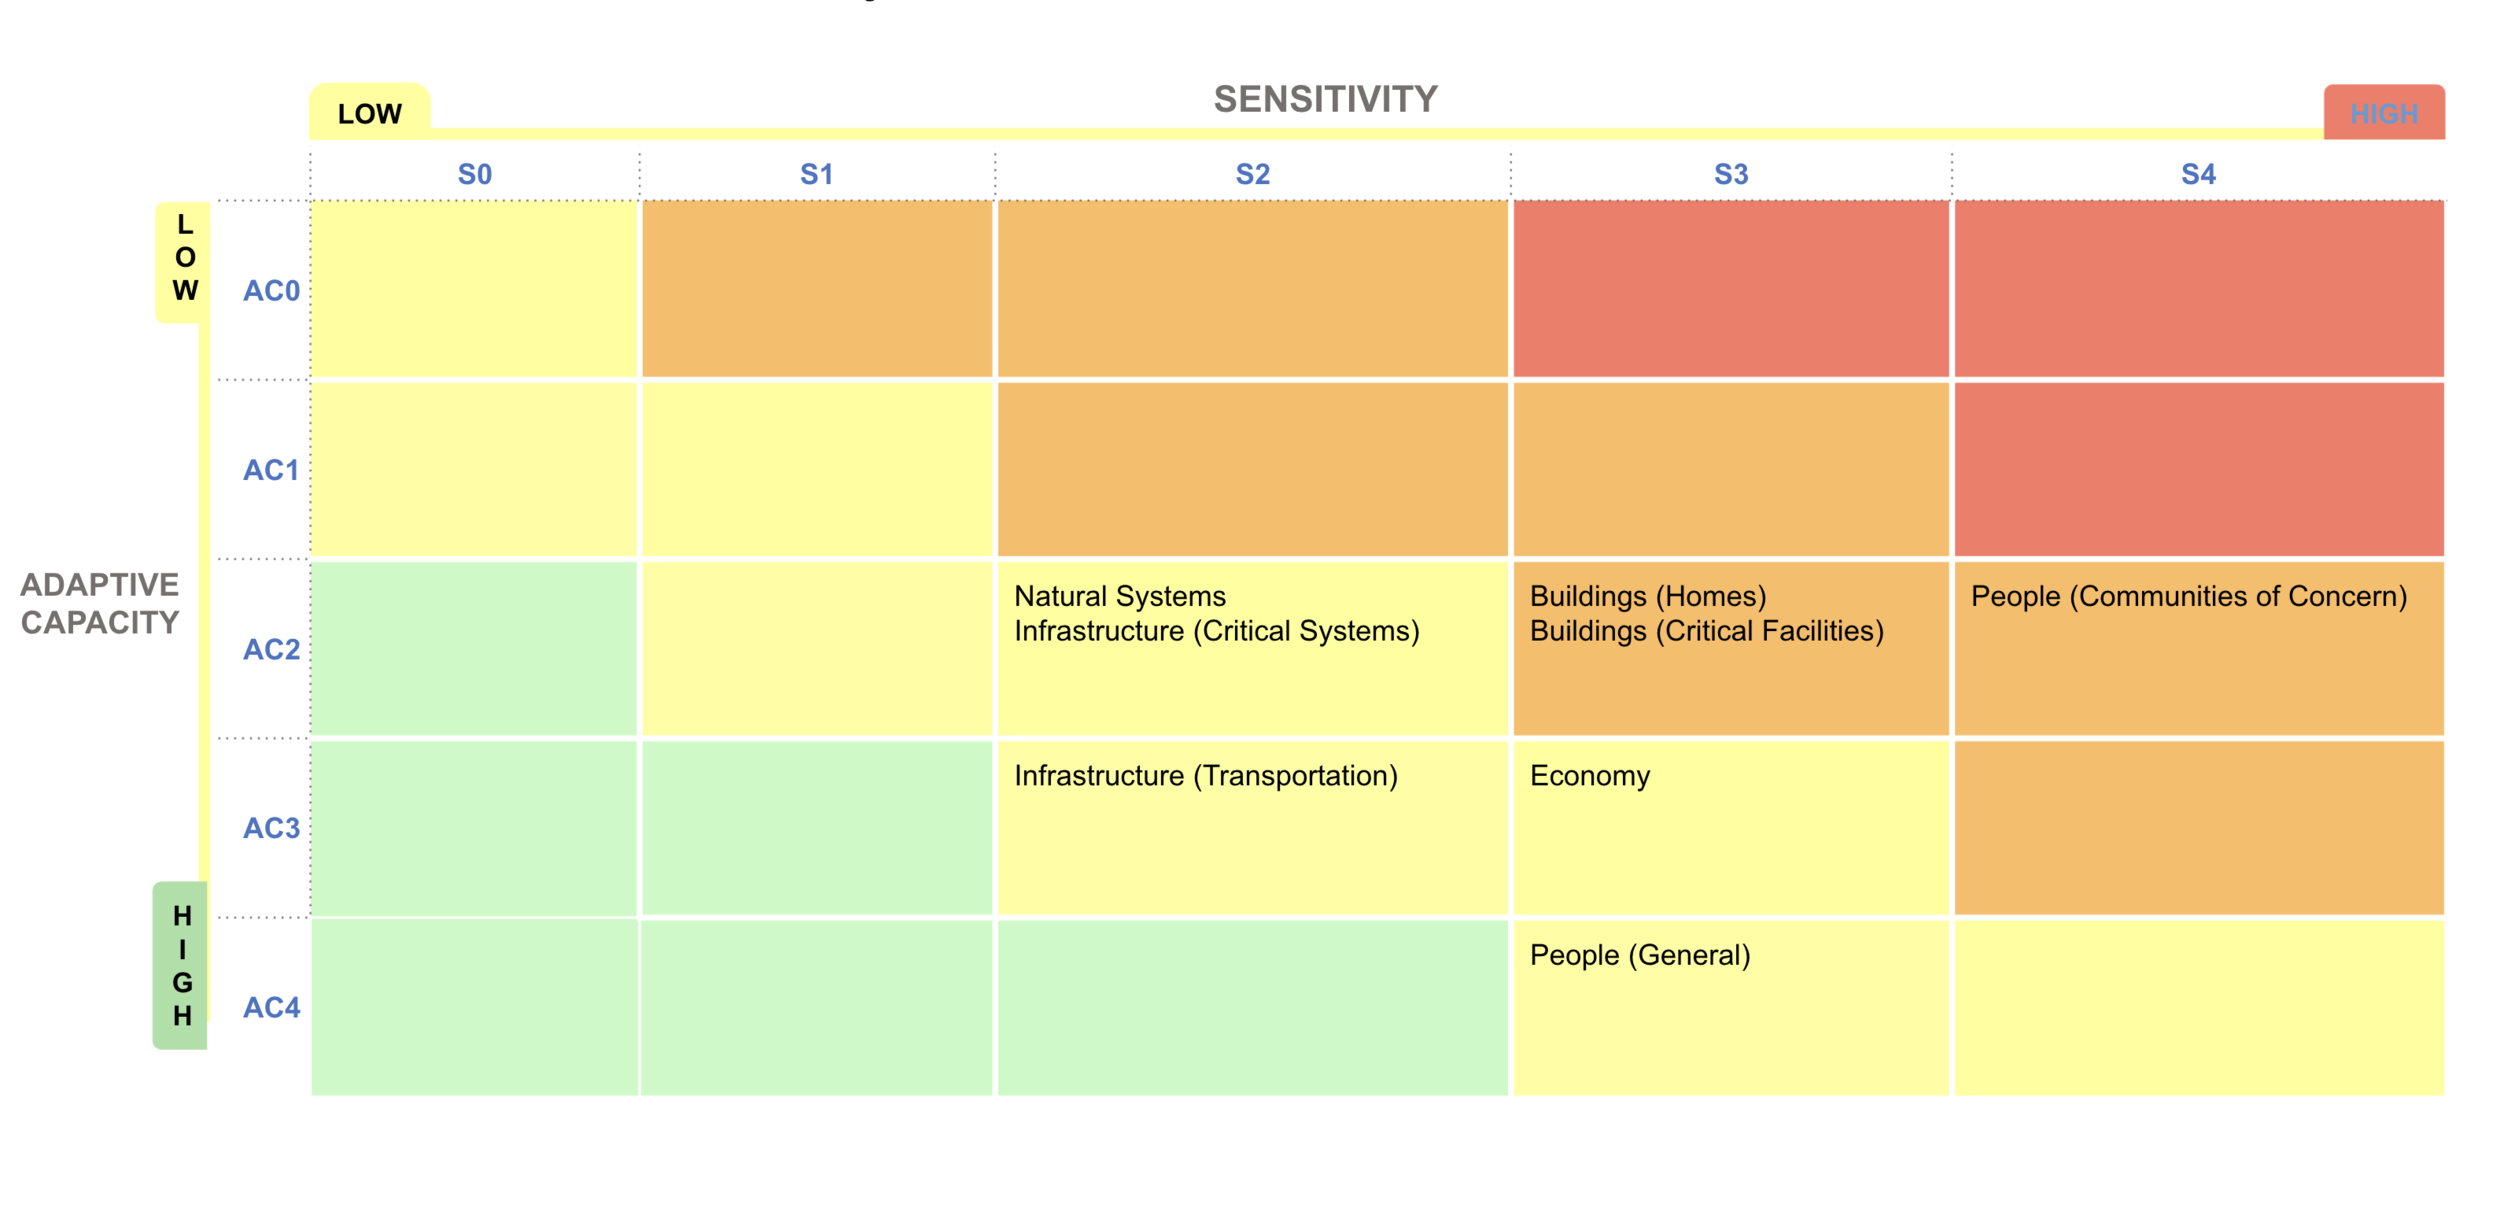
Relative vulnerability assessment of wildfire for Windsor’s primary assets categories. Vulnerability is shown by the different colors of the matrix (Red = Extreme Vulnerability; Orange = High Vulnerability, Yellow = Medium Vulnerability; and Green = Low Vulnerability). Given the climate hazards, relative vulnerability is based on the assessment of sensitivity (x-axis ranging from S0 = not at all sensitive to the projected changes to S4 = extremely sensitive to the projected changes) and adaptive capacity (ability to respond to those changes ranging from AC0 = no ability to respond to AC4 = ability to respond to projected changes in a beneficial way).
In addition to current and historical fire-suppression policies at the federal and state levels and increasing population growth in the Wildland Urban Interface (WUI), climate change is exacerbating the frequency, intensity, and severity of wildfires across the State of California. In addition, the average area burned statewide could increase 77% by 2100. Increased exposure and potential impact to health and safety of residents of wildfire and smoke make residents, homes, and critical facilities highly vulnerable to wildfire. While Windsor’s infrastructure networks have built-in redundancies, and the natural system has evolved with wildfire to survive and thrive, the increased exposure, intensity, and extent of wildfire under changing climate conditions make both systems moderately vulnerable to wildfire. The expanding wildfire season and the perceived increase in wildfire risk will continue to increase concern of visitors and makes the local economy moderately vulnerable.
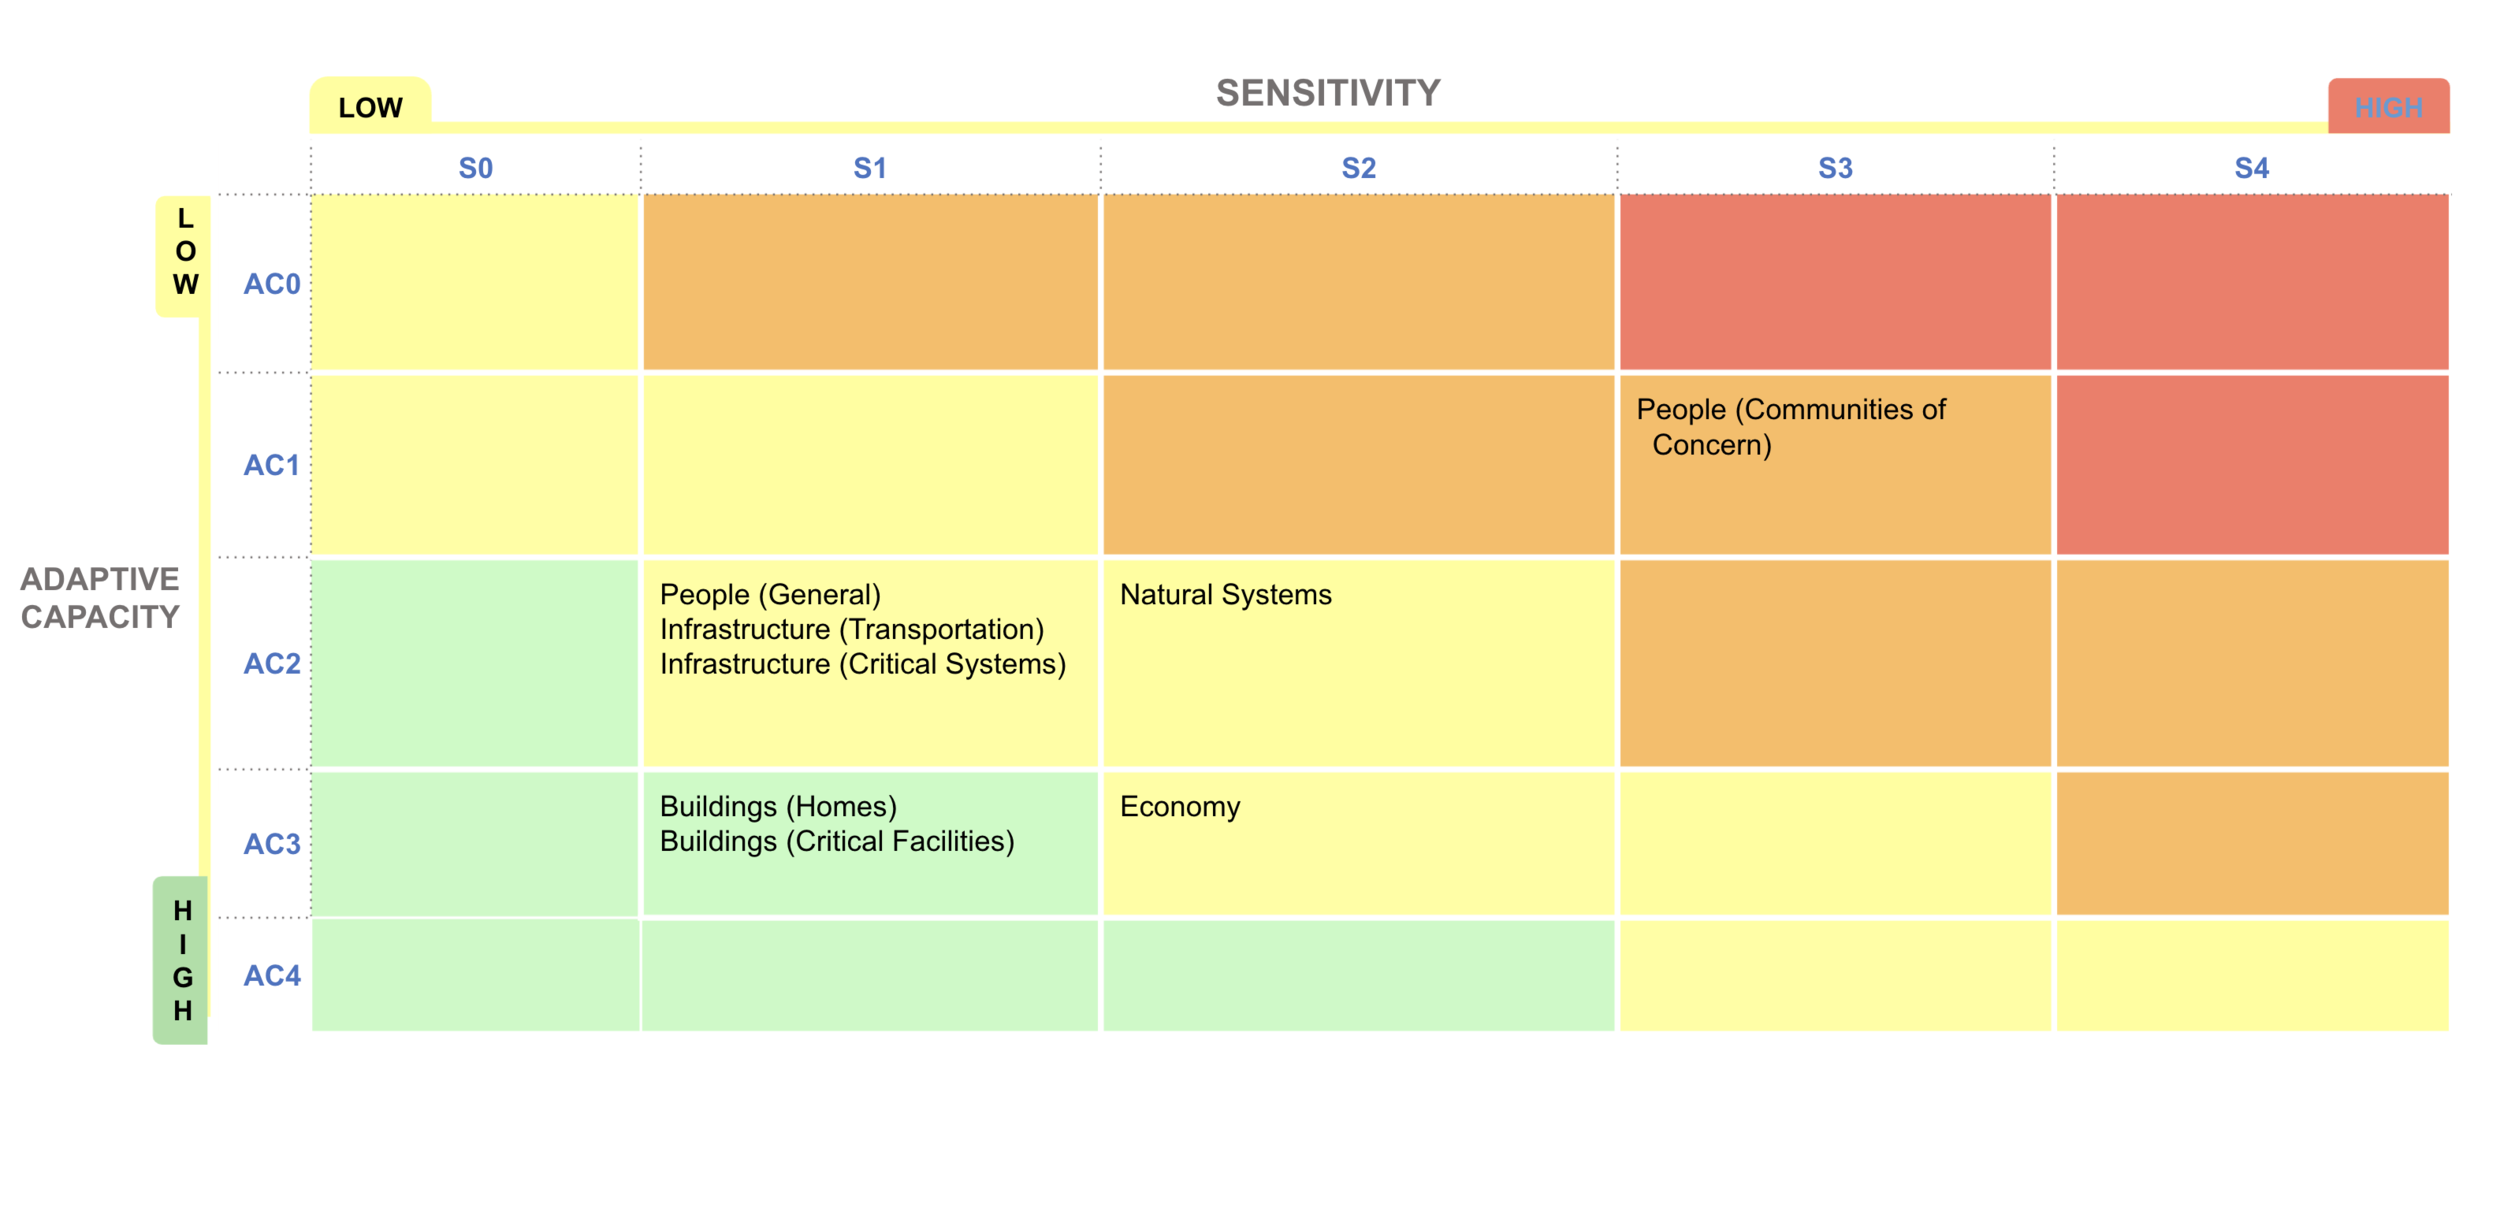
FLOODING

Relative vulnerability assessment of flooding for Windsor’s primary assets. Vulnerability is shown by the different colors of the matrix (Red = Extreme Vulnerability; Orange = High Vulnerability, Yellow = Medium Vulnerability; and Green = Low Vulnerability). Given the climate hazards, relative vulnerability is based on the assessment of sensitivity (x-axis ranging from S0 = not at all sensitive to the projected changes to S4 = extremely sensitive to the projected changes) and adaptive capacity (ability to respond to those changes ranging from AC0 = no ability to respond to AC4 = ability to respond to projected changes in a beneficial way).
Windsor has experienced highly variable precipitation patterns over the last few years and research suggests that these cycles of wet and dry years will continue. While overall average annual precipitation may remain fairly constant, there will also be more intense storms and more precipitation in shorter amounts of time.
Windsor residents have limited vulnerability to flooding, as individuals are highly unlikely to be in danger of flood forces from riverine or rainfall sources. Most buildings and critical infrastructure are located outside of the 100- and 500-year flood zones, making them only moderately vulnerable to flooding. Flooding that is most likely to occur would be temporary and in only a few areas; however, it could contaminate and/or impact the local fresh water supply.
EXTREME HEAT

Relative vulnerability assessment of extreme heat for Windsor’s primary assets. Vulnerability is shown by the different colors of the matrix (Red = Extreme Vulnerability; Orange = High Vulnerability, Yellow = Medium Vulnerability; and Green = Low Vulnerability). Given the climate hazards, relative vulnerability is based on the assessment of sensitivity (x-axis ranging from S0 = not at all sensitive to the projected changes to S4 = extremely sensitive to the projected changes) and adaptive capacity (ability to respond to those changes ranging from AC0 = no ability to respond to AC4 = ability to respond to projected changes in a beneficial way).
Average annual maximum temperatures in Sonoma County and the surrounding region have increased and are projected to continue to increase. As part of this broader trend, the number of days with extreme heat is expected to dramatically increase, both within Windsor and the surrounding county as a whole.
All residents, especially communities of concern, are highly vulnerable to extreme heat events. Prolonged heat events put an increased demand on certain infrastructure systems (e.g. electricity for cooling homes and buildings), making them moderately vulnerable to extreme heat. Extreme heat reduces the amount of moisture in soils and can exacerbate drought conditions and affect agricultural crops, such as grapes.
DROUGHT


Relative vulnerability assessment of drought for Windsor’s primary assets. Vulnerability is shown by the different colors of the matrix (Red = Extreme Vulnerability; Orange = High Vulnerability, Yellow = Medium Vulnerability; and Green = Low Vulnerability). Given the climate hazards, relative vulnerability is based on the assessment of sensitivity (x-axis ranging from S0 = not at all sensitive to the projected changes to S4 = extremely sensitive to the projected changes) and adaptive capacity (ability to respond to those changes ranging from AC0 = no ability to respond to AC4 = ability to respond to projected changes in a beneficial way).
Seasonal precipitation patterns in the region are also likely to change. In addition to longer periods of drought, increasingly hot days and nights will occur, further heightening the intensity of the region’s dry summer seasons. As a result, there will be less surface water and drier soils which can affect both agriculture and the functioning of natural ecosystems in the region.
Drought mainly impacts water supply and availability, which can cause differential impacts to residents, depending on many factors. Infrastructure and buildings are moderately vulnerable to drought, mainly due to the link to increased risk of wildfire and impacts to water systems. Natural systems, both terrestrial and aquatic, are highly vulnerable to prolonged drought conditions.